You’ve conducted the research to decipher who your market segments are. You now have spreadsheets full of data. But how can you make this information easily understood and shared, so that everyone in your organization – from R&D to Marketing – can act on it?
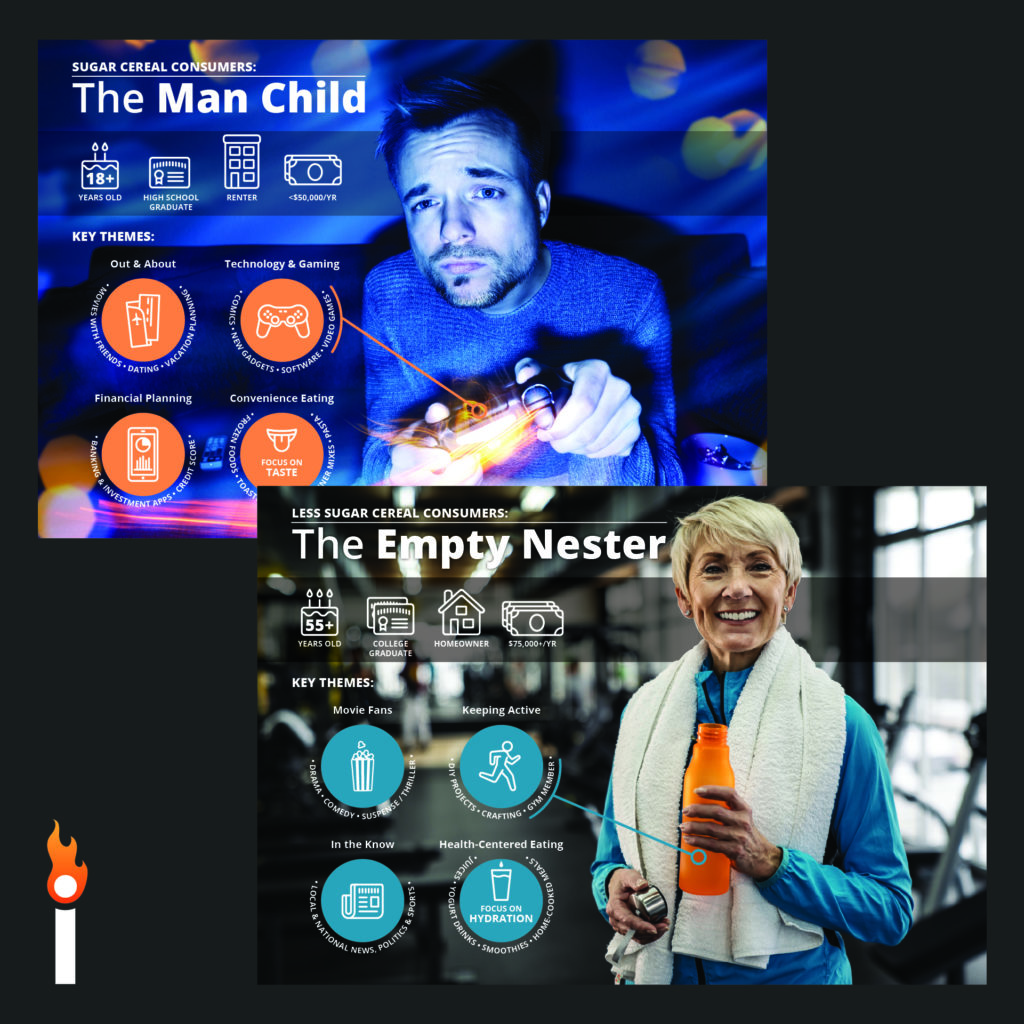
When you truly know your audience, you know how to win them over. To understand your market segments, they need faces and real-life context to give the data meaning.
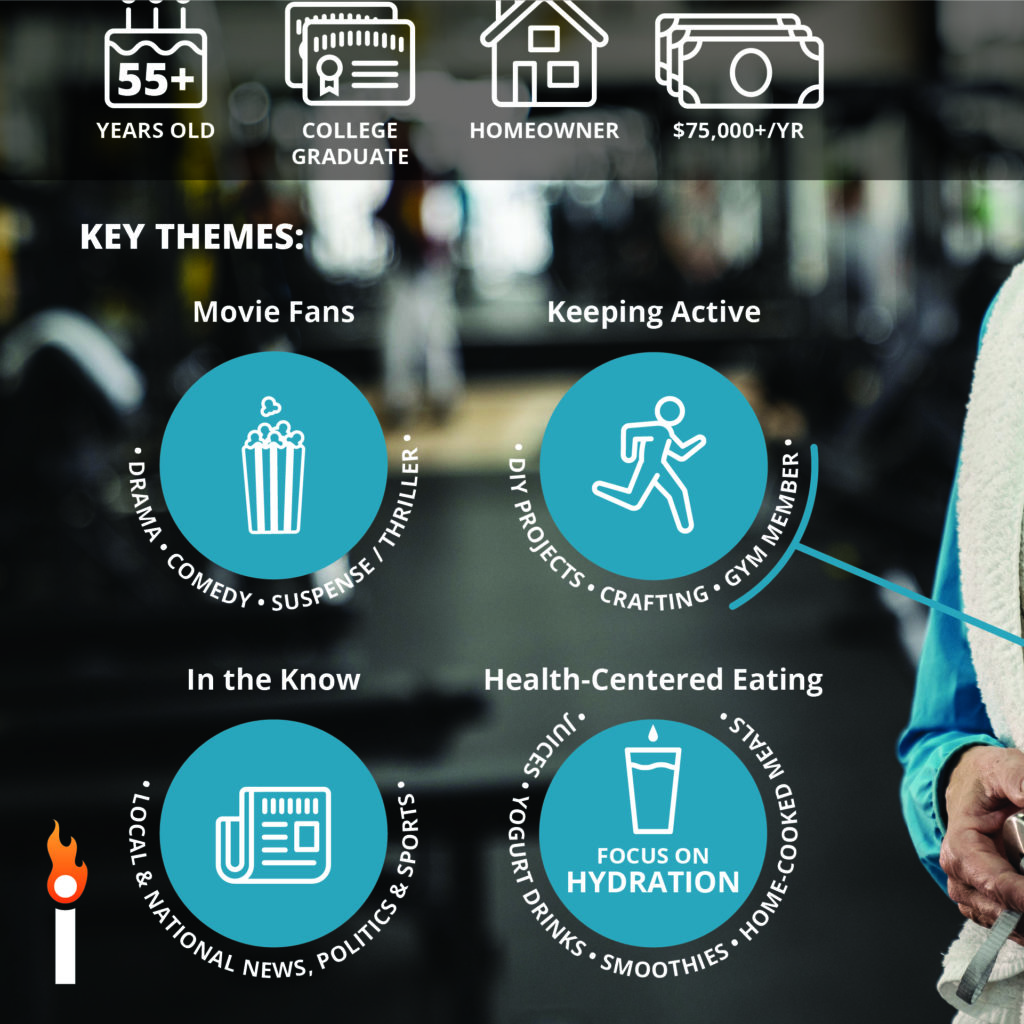
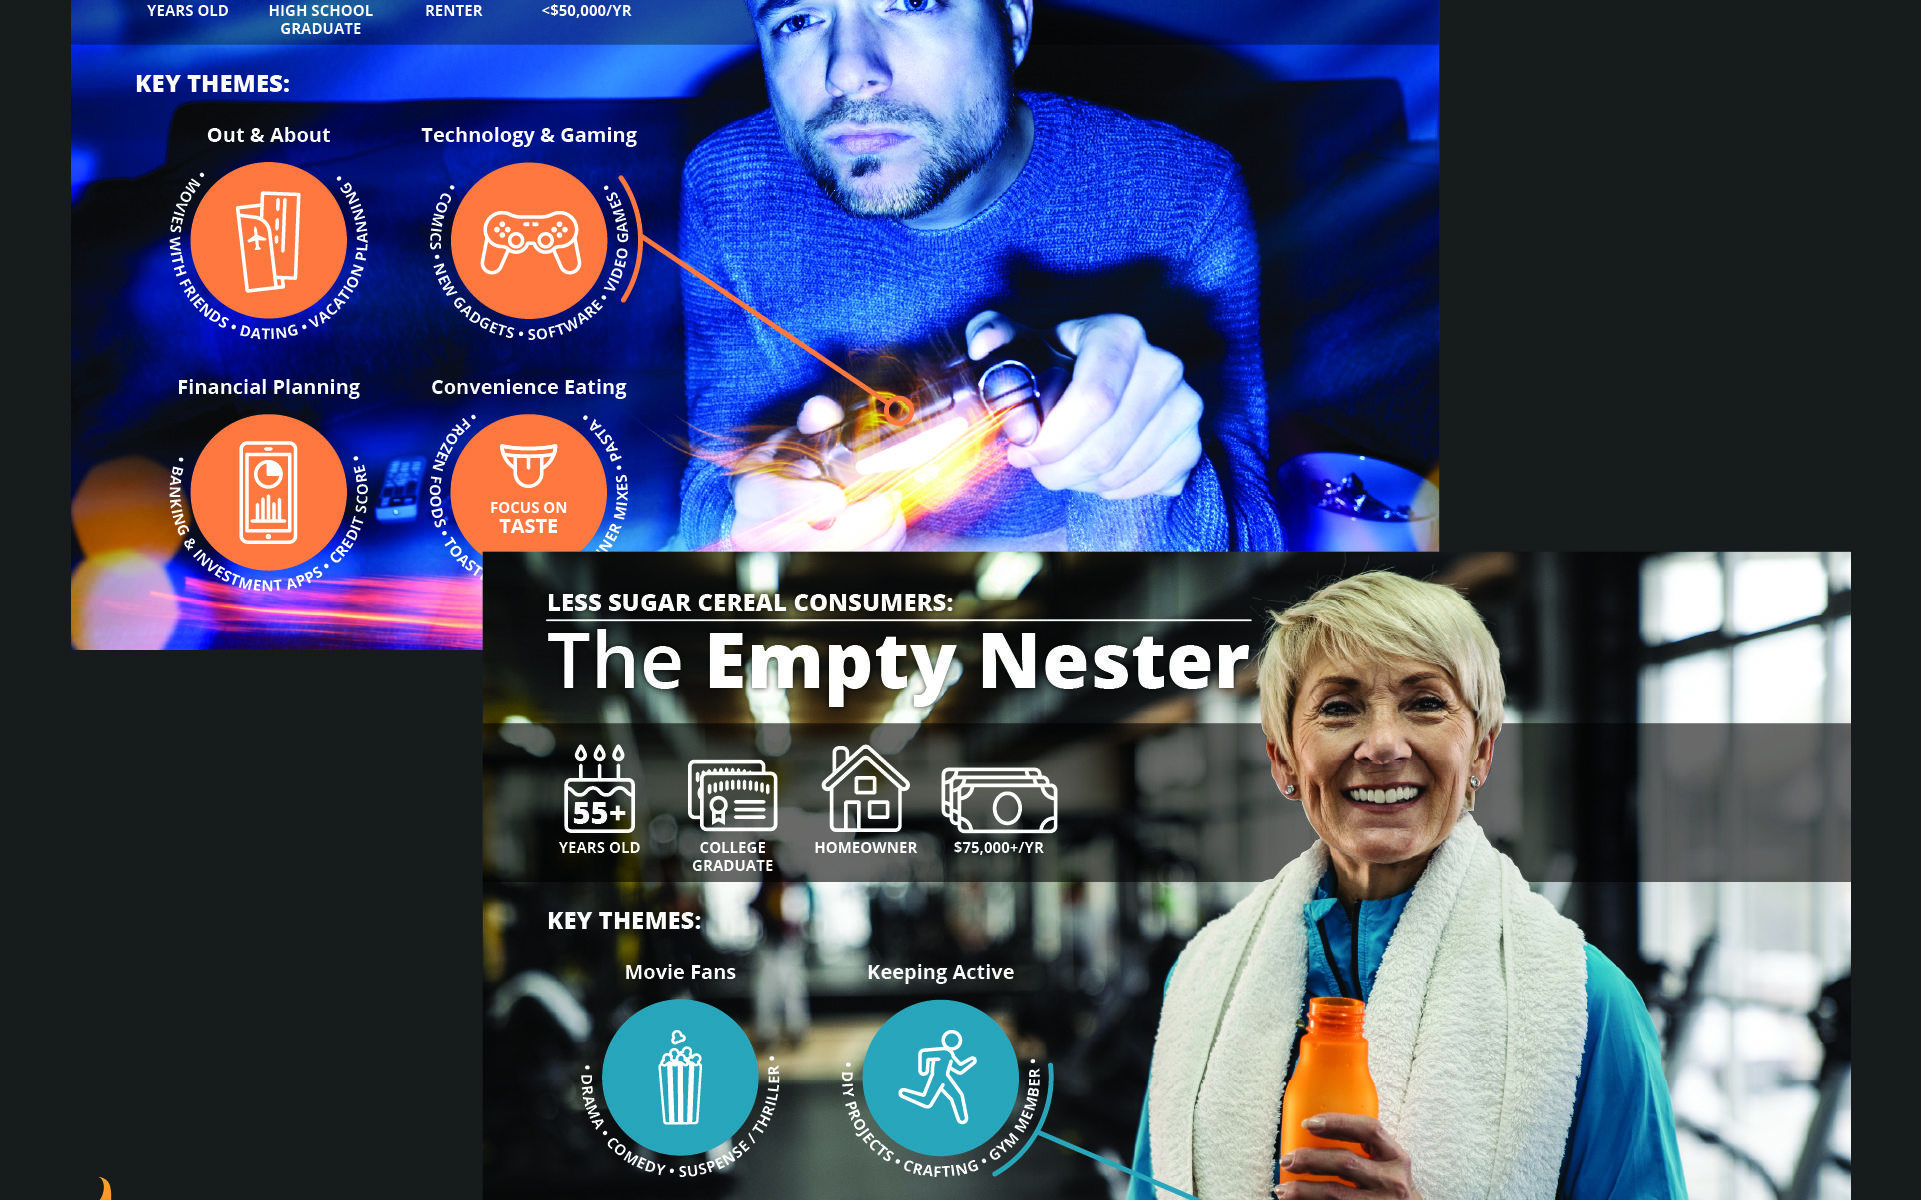
A compelling blend of photography, typography and iconography will not only convey your segments’ data, but help you to envision their priorities, their wants and needs, and their humanity. And being concise and beautiful, they’re easy to share with everyone in your organization.

See other samples of our work here.


