Any primary research data has been altered to protect proprietary information.
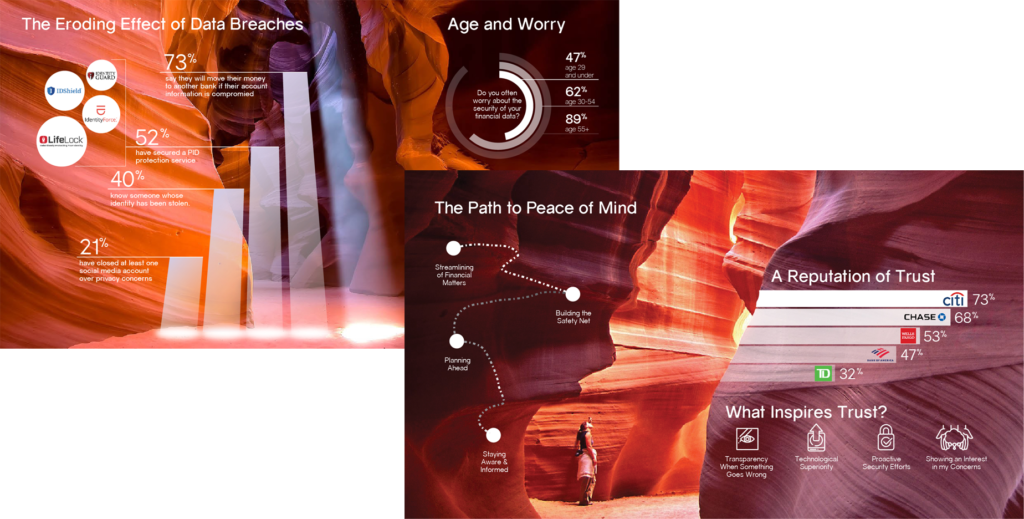
Infographics & Journey Maps
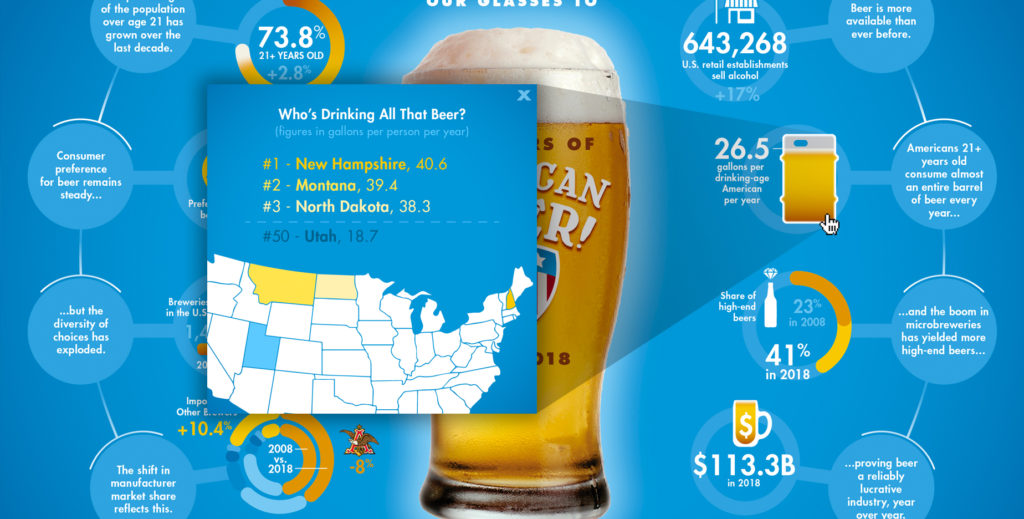
Richly visual and powerfully concise, infographics can summarize entire studies into one comprehensive piece, making the full scope of a project easy to comprehend and fun to socialize within your organization. Both meaningful and beautiful, our clients often make our infographics wall art in their offices.
Deeply understanding your market segments grants you the power to act with confidence. To enhance your understanding, we create profiles that paint vivid portraits of your segments. Real people in real environments, to give you real market wisdom.
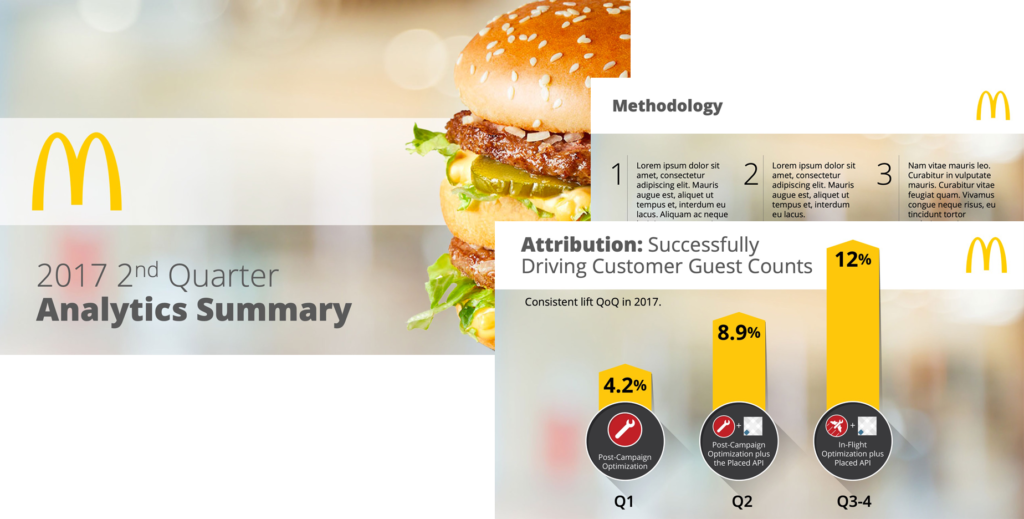
Reports & Decks
Whether a short presentation deck or an in-depth report, we can elevate your research beyond those stale PowerPoint templates and cookie cutter charts and graphs to make each slide unique.
Feature Slides
Yes, sometimes you need to have that 80-slide deck, but there’s no need to torture your audience. Break up the sections of your report with beautiful feature slides that summarize each section in a memorable way, often tied together across a report with a common theme.
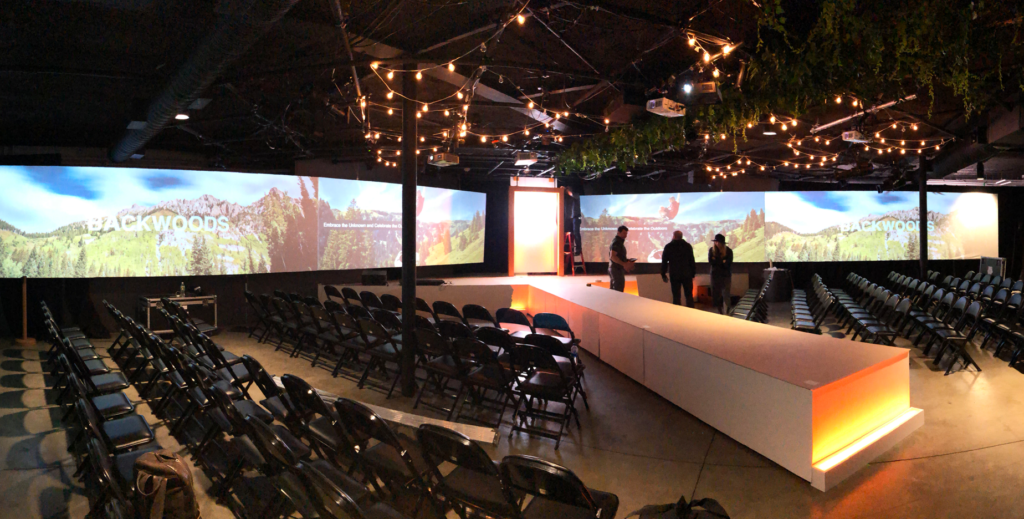
Immersion Spaces
Give your audience the opportunity to see your research from a new perspective. Let them see, touch and hear the story of your data. Creating an immersive space doesn’t merely teach; it enlivens the findings and enlightens your audience.
Digital Experiences
Bringing your data into a digital experience can invigorate the learning. We have expertise in creating content-rich interactive infographics and journey maps, animated videos, and virtual/augmented reality elements as vehicles to innovate the socialization of your data.
Bring the universal accessibility of video to your research by explaining the key insights with video, animation, music and voiceover.
The adjacent video is a sample in which we explain the difference between what most people mean by “data visualization,” versus what we bring to market research, and why creating meaning in research reporting is so important.