Don’t Let Your Insights Drown in Data!

It’s easy to mistake quantity for quality. Providing your clients an ocean of data shows the thoroughness and depth of the work you’ve done, right? Sure, but it’s easy to lose sight of the key takeaways and actionable insights if your client is lost at sea.

The solution is to rescue your insights with visualization:

infographic icon

Infographics

Richly visual and powerfully concise, infographics can summarize entire studies into one comprehensive piece, making the full scope of a project easy to comprehend and fun to socialize within your organization.

presentation deck icon

Presentation Decks

Whether a short presentation deck or an in-depth report, we can elevate your research beyond those stale PowerPoint templates and cookie cutter charts and graphs to make each slide unique.

video icon

Video Sizzles

Bring the accessibility of video to your research by explaining the key insights with video, animation, music and voiceover. We can edit highlights of qualitative fieldwork or create graphics to convey quantitative findings.

Make the insights you’ve discovered easy to understand, socialize and act on, and your clients will see you as an indispensable partner in their success.

Click here to see more samples of how visualized data makes the most important insights clear. Would you like to chat with us to see how we can illuminate your data? Drop us a line.

Custom Icons: Why Create Them?

We all use icons, but not all icons are created equal.

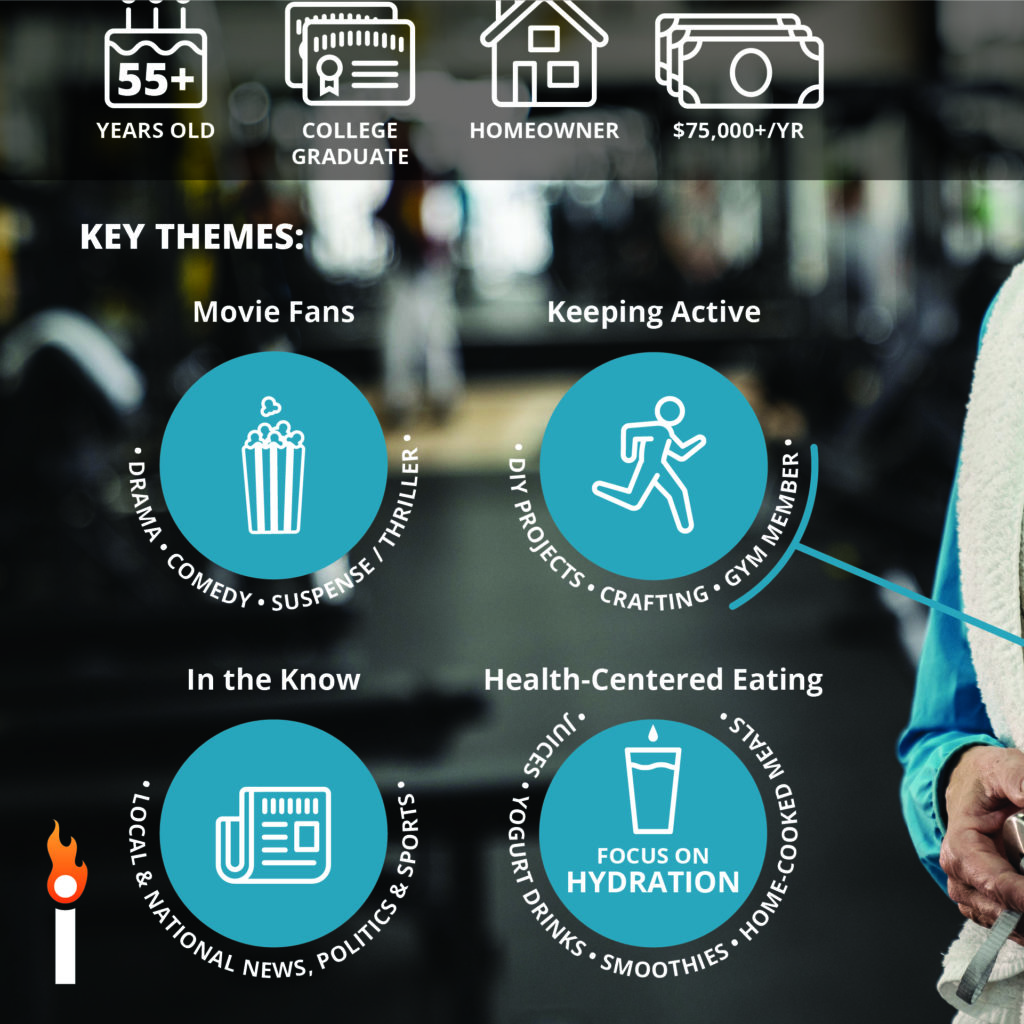
A hodgepodge of stock icons you found on the internet will likely hurt your presentation deck or infographic more than they will help it. They don’t fit with each other, they don’t support your brand, and they tell an incomplete story. The result is a lower opinion of – and therefore lower engagement with – the information you’re presenting.

Here are a few good reasons for designing visually unified iconography for your marketing & presentations.

1. Greater Cohesion

Unify your piece with icons that are all in the same visual style, a style that supports your brand and/or the message you’re conveying.

2. More Specificity

Icons that are custom-designed for your specific use tell a richer, more precise story, which better educates your audience.

3. Increased Interest

Novel imagery captivates in a way that stock icons cannot. Beauty will keep your audience focused on your important content.

Tell the whole story with custom icons, tell it beautifully, and you’ll see better results.

Want to see more examples of our work? Click or tap here.

Ready to get started? Drop us a line.

Visualize Your Market Segments

market segment profiles

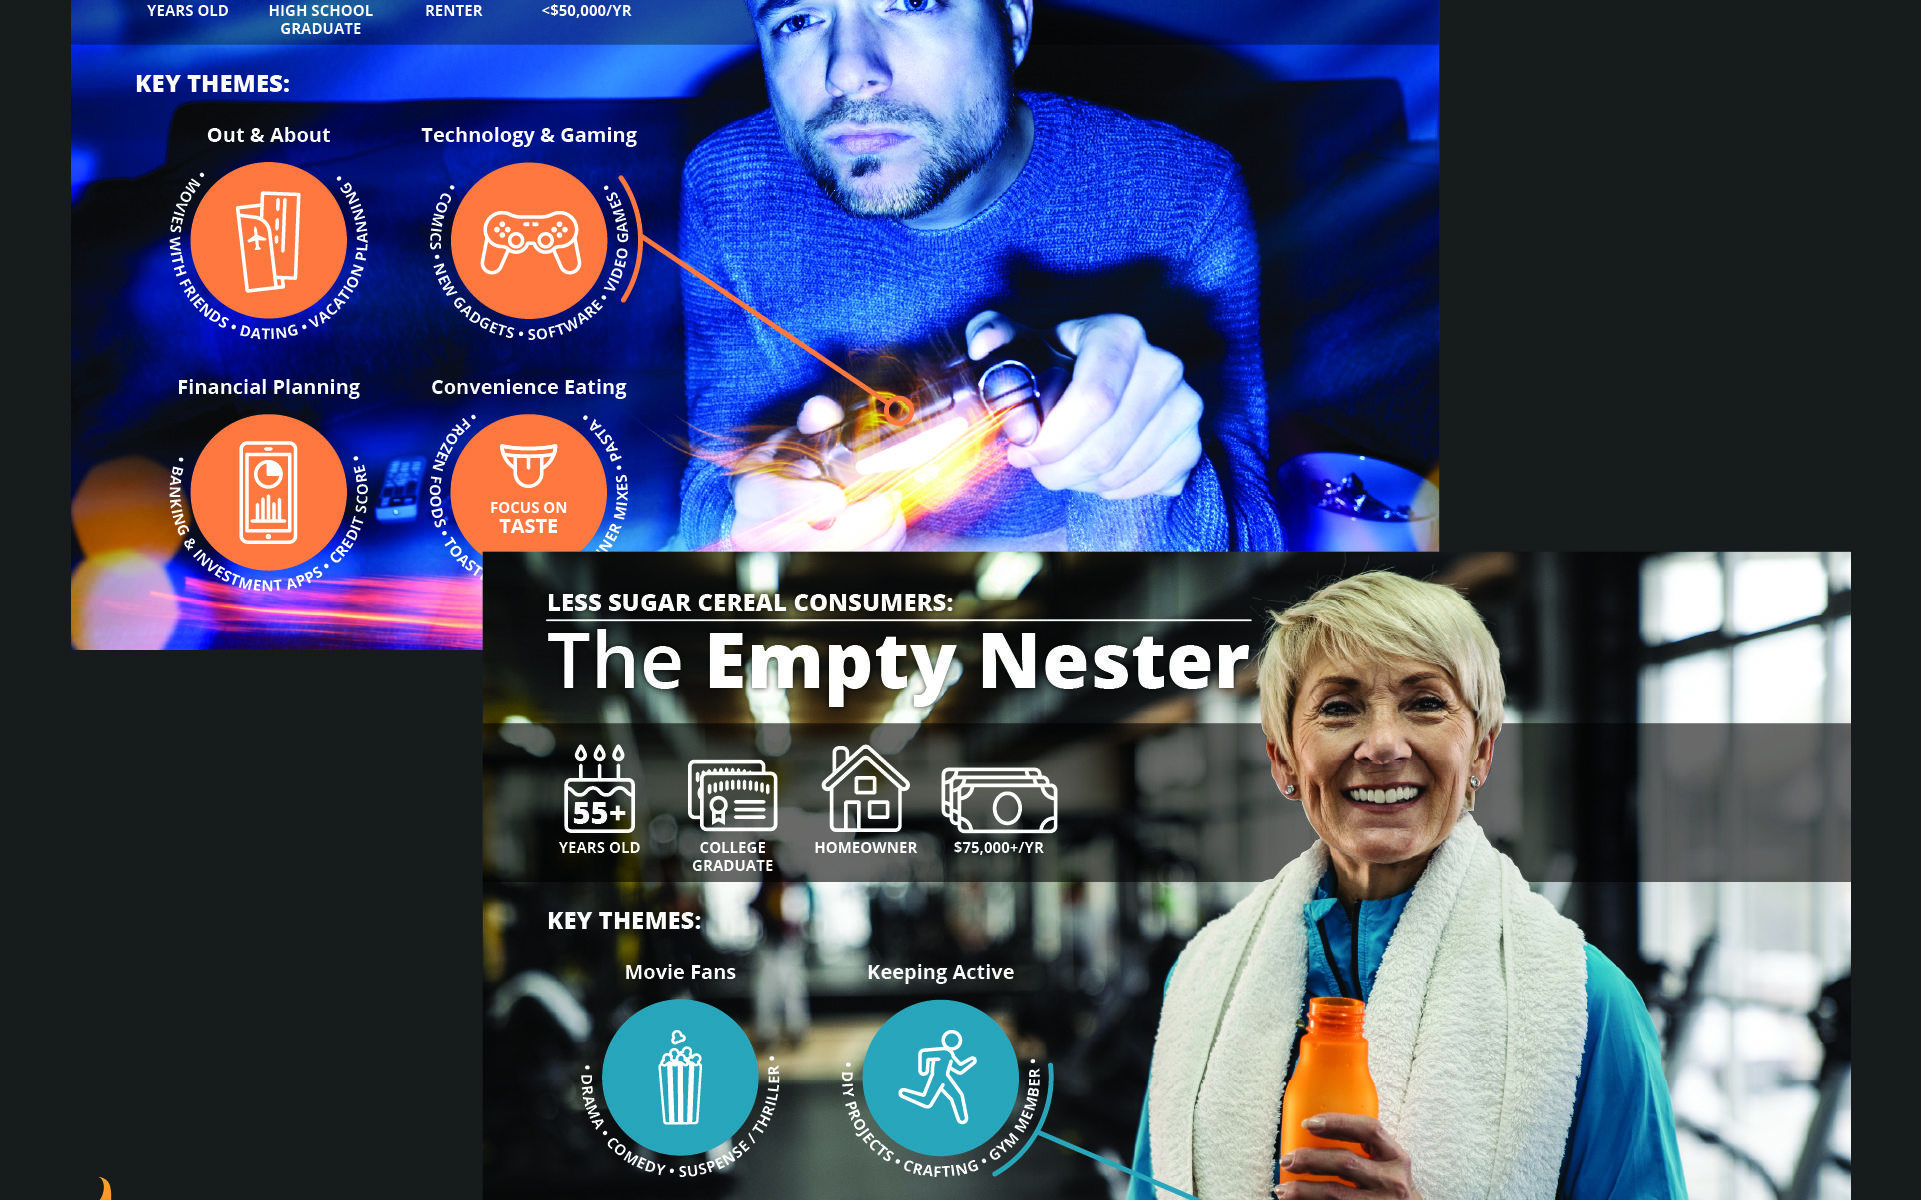
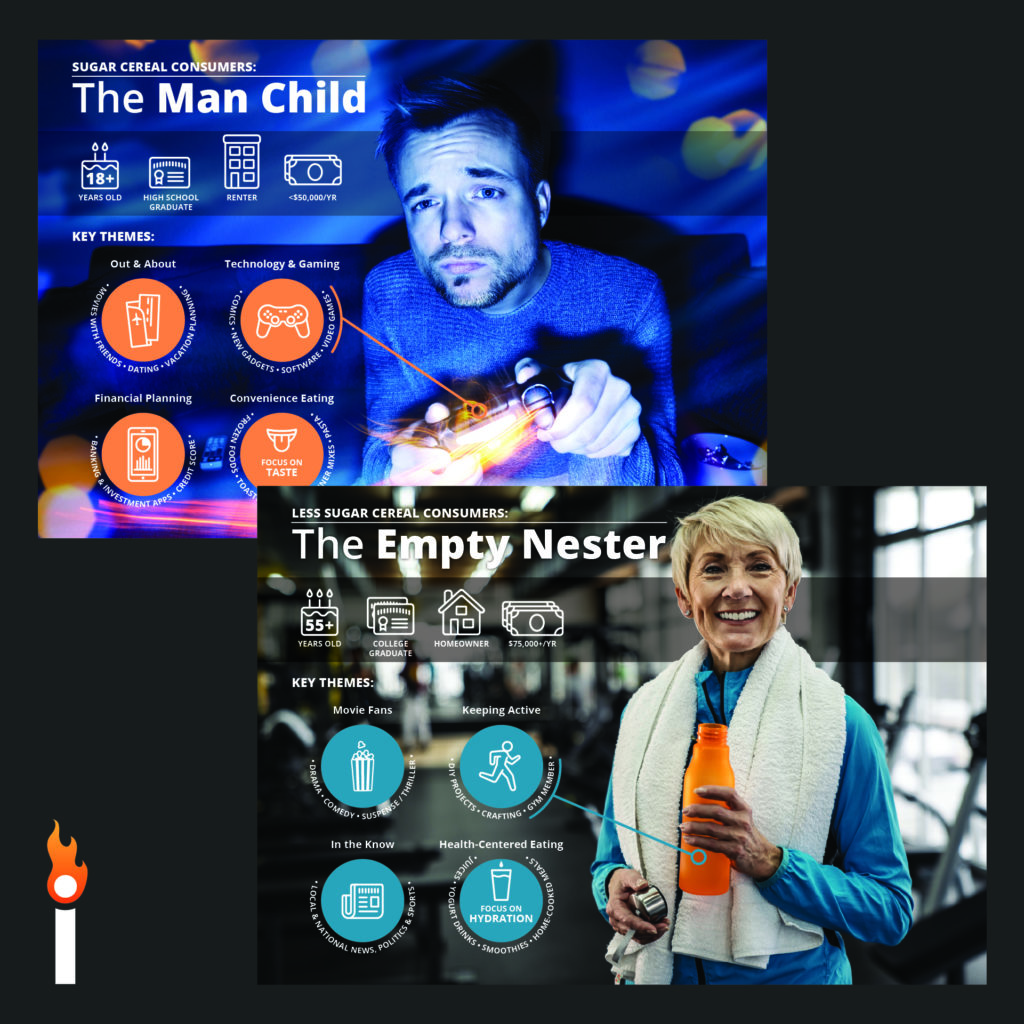
You’ve conducted the research to decipher who your market segments are. You now have spreadsheets full of data. But how can you make this information easily understood and shared, so that everyone in your organization – from R&D to Marketing – can act on it?

When you truly know your audience, you know how to win them over. To understand your market segments, they need faces and real-life context to give the data meaning.

A compelling blend of photography, typography and iconography will not only convey your segments’ data, but help you to envision their priorities, their wants and needs, and their humanity. And being concise and beautiful, they’re easy to share with everyone in your organization.

See other samples of our work here.