
Click on any of the hotspots below to learn more.
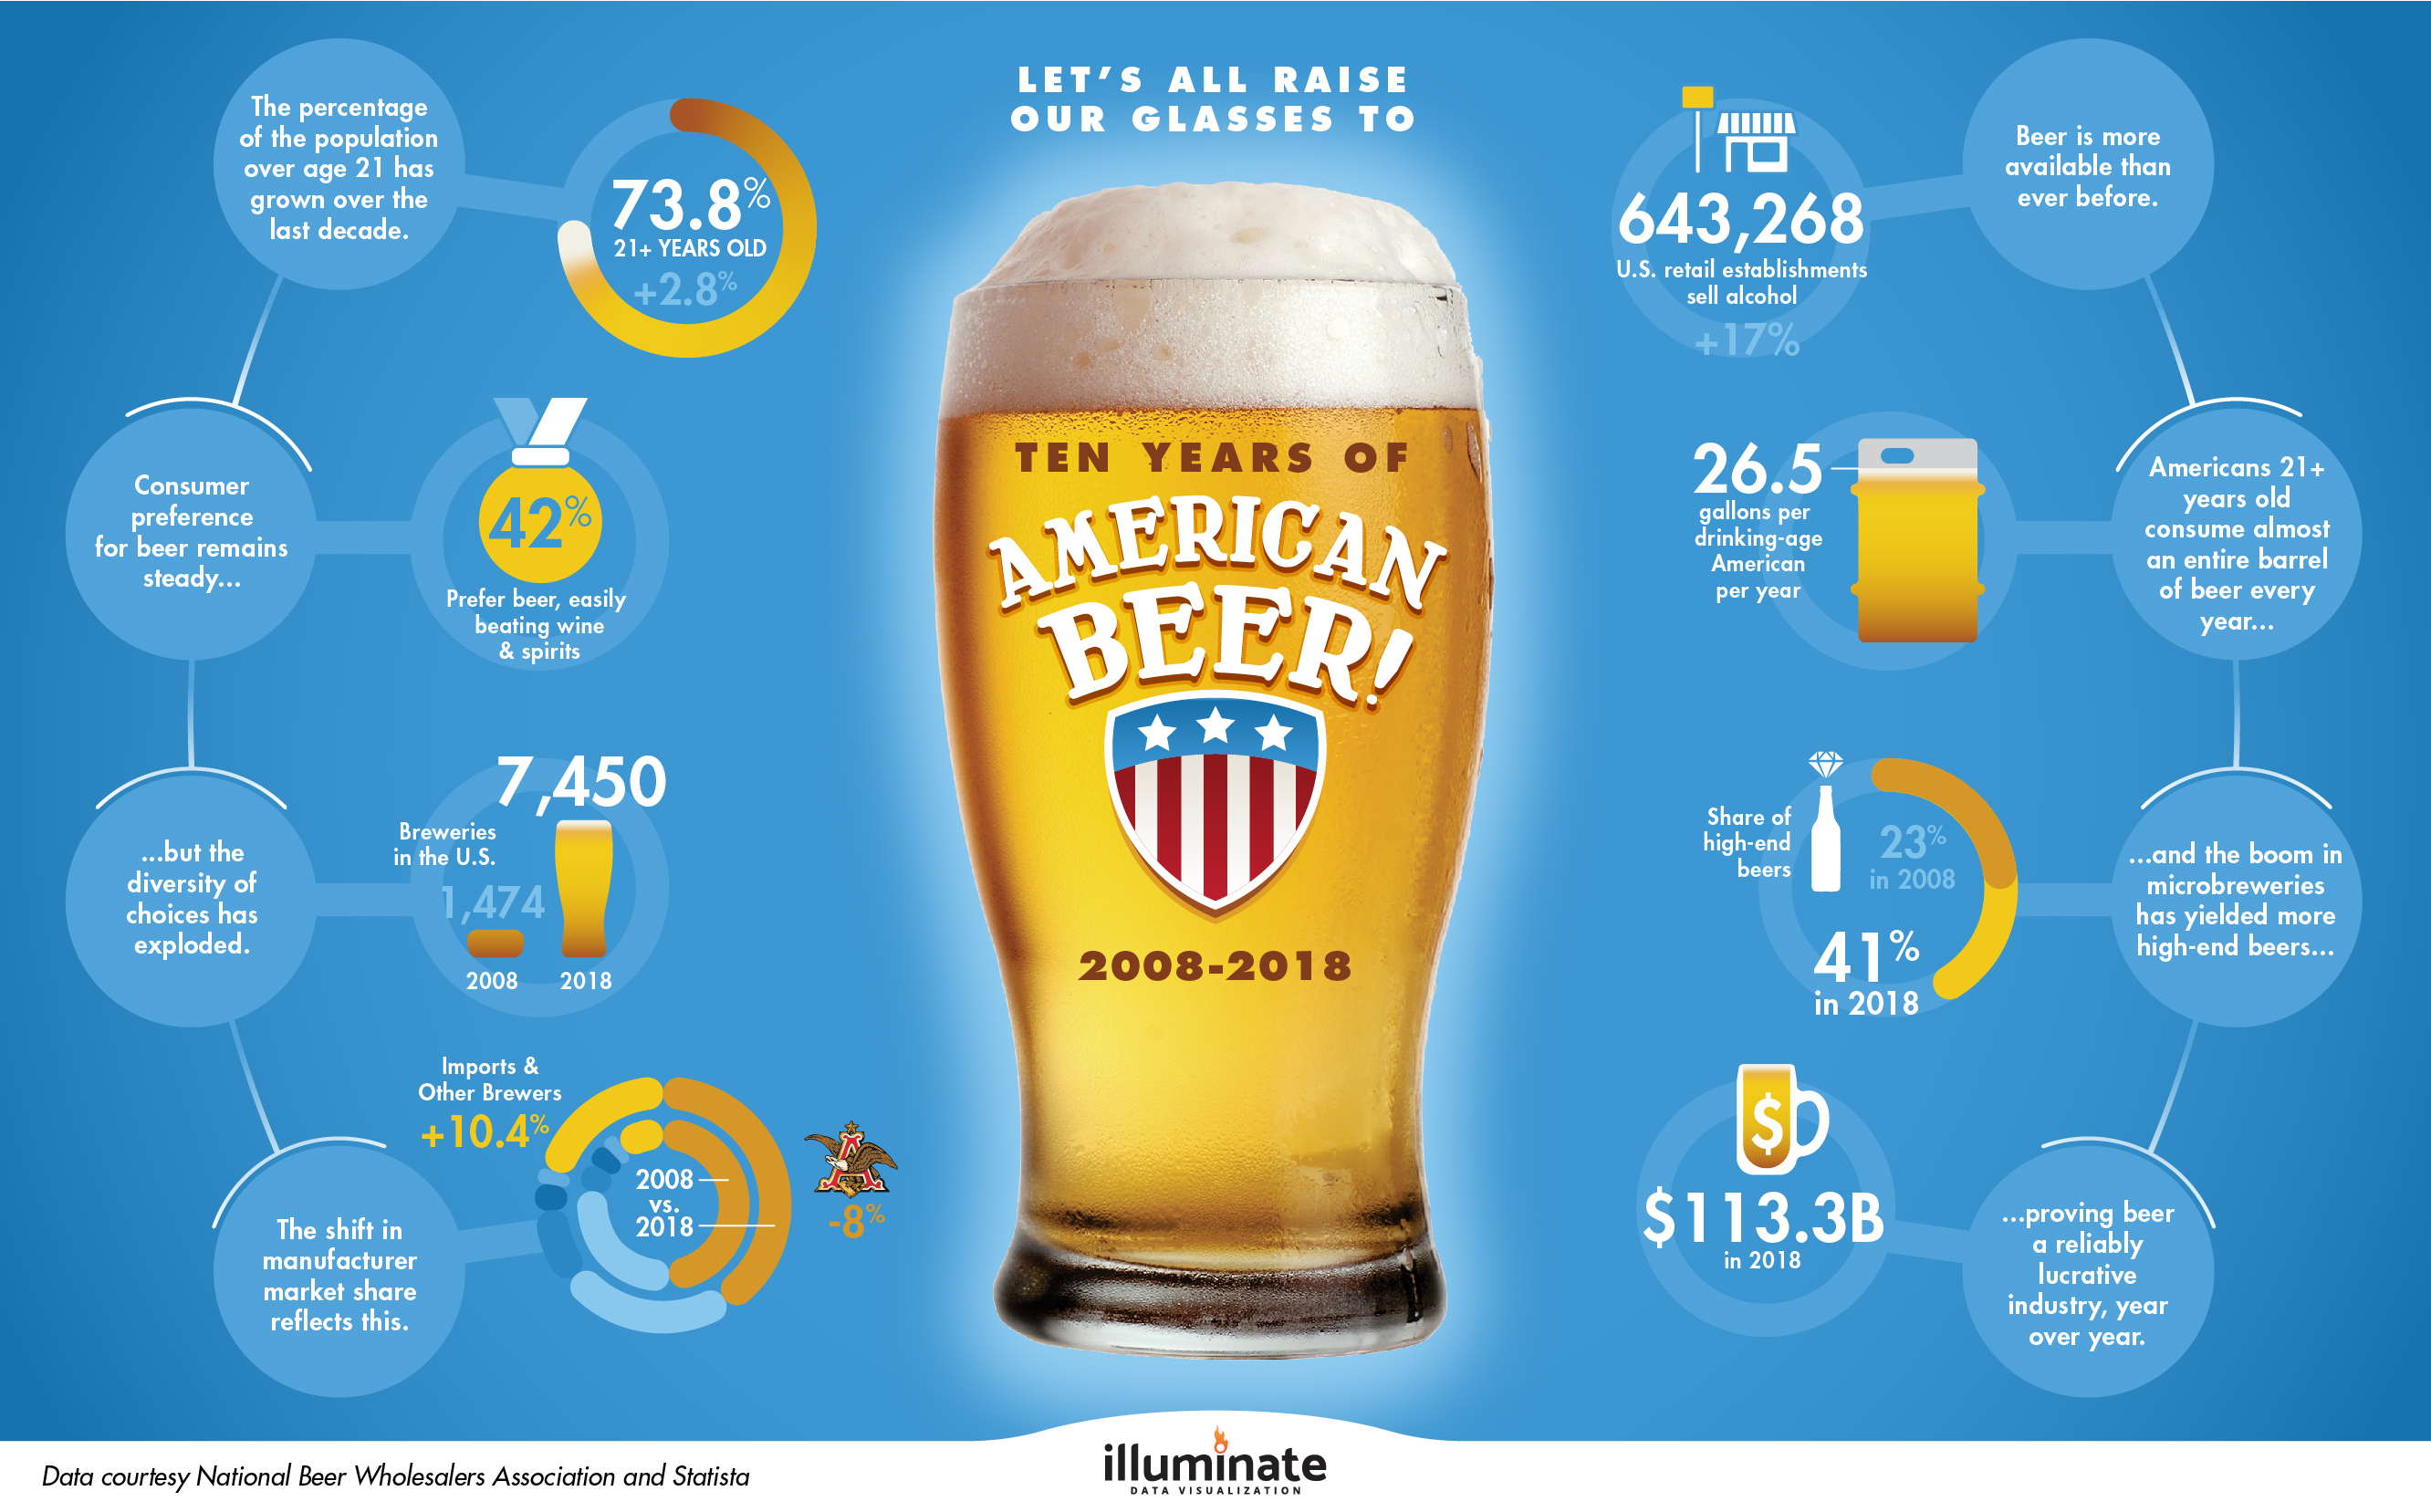
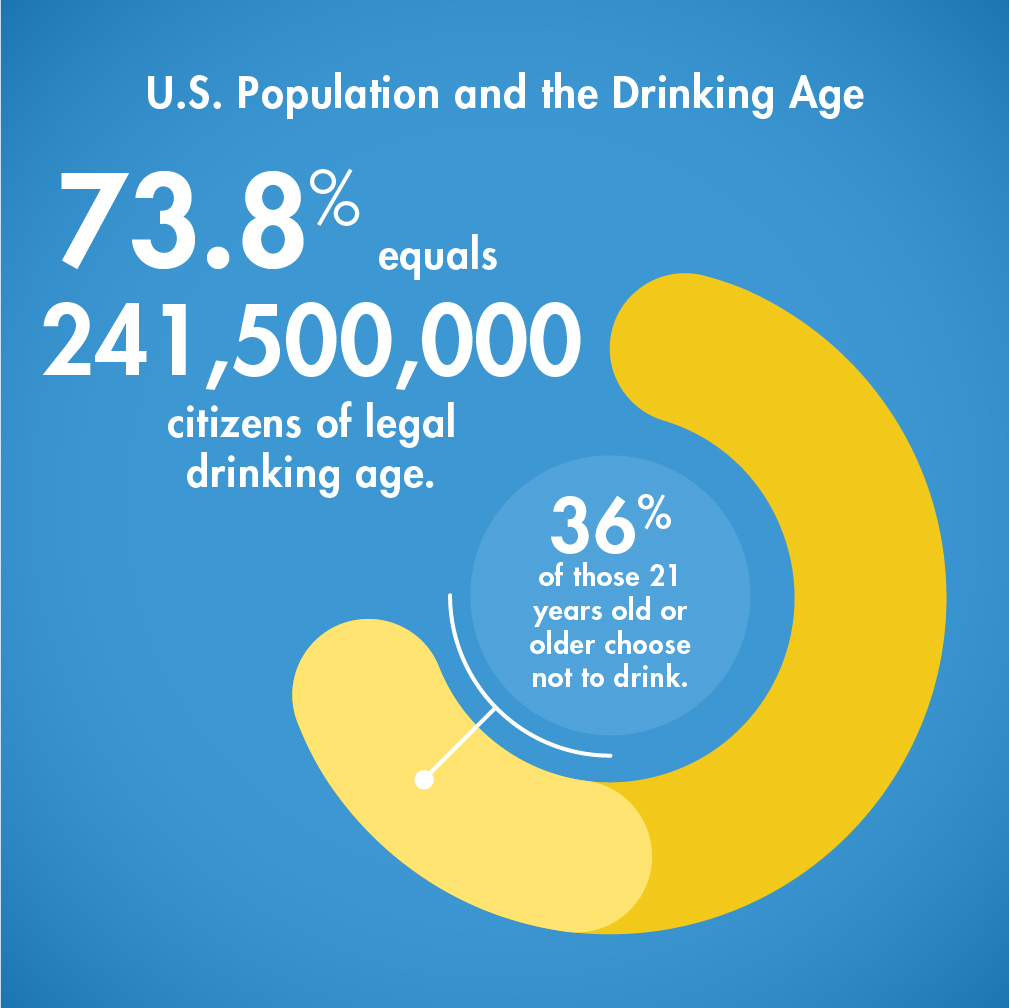
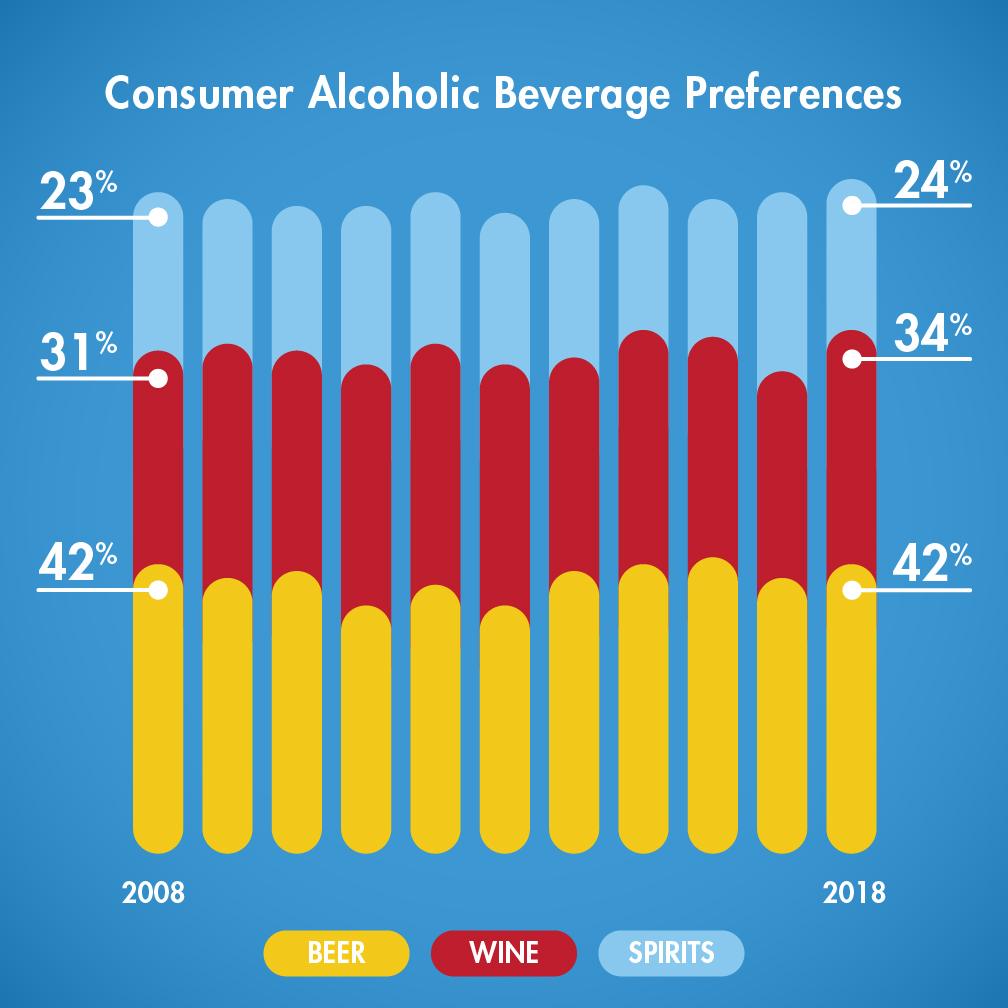
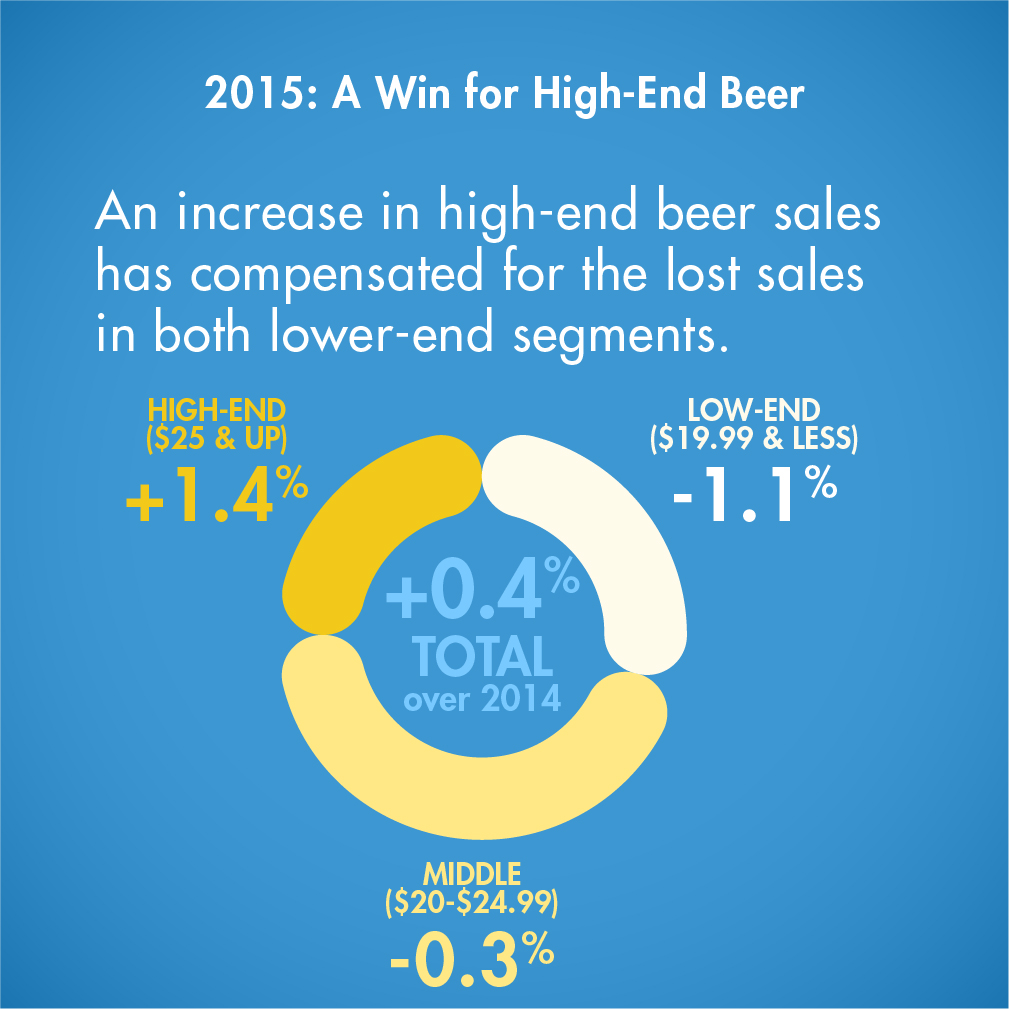
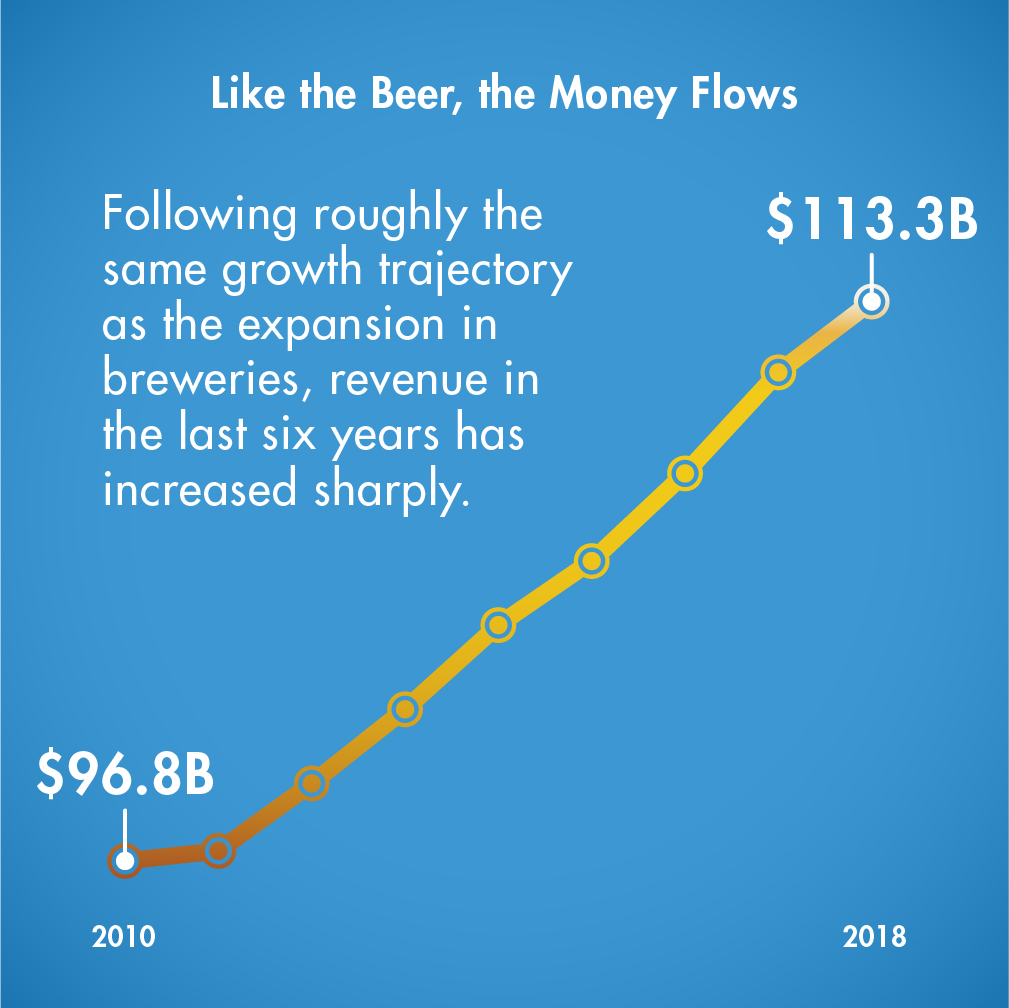
In this sample, the hotspots reveal visualized data. This allows viewers to drill down and learn more about each point in the infographic in an exploratory, non-linear fashion. Depending on the study type and the assets on hand, you could also provide open end responses or verbatims, images of the provided stimulus, video highlights from field work, or explain key findings from the study.
In the event you have a great deal more information to share on a certain point or points, hot spots can link to full pages, each with their own text and media. This ability enables your infographic to become a hub for a wealth of beautiful, easily shareable information.
For sensitive and proprietary data, we can enable password protection for the entire experience.