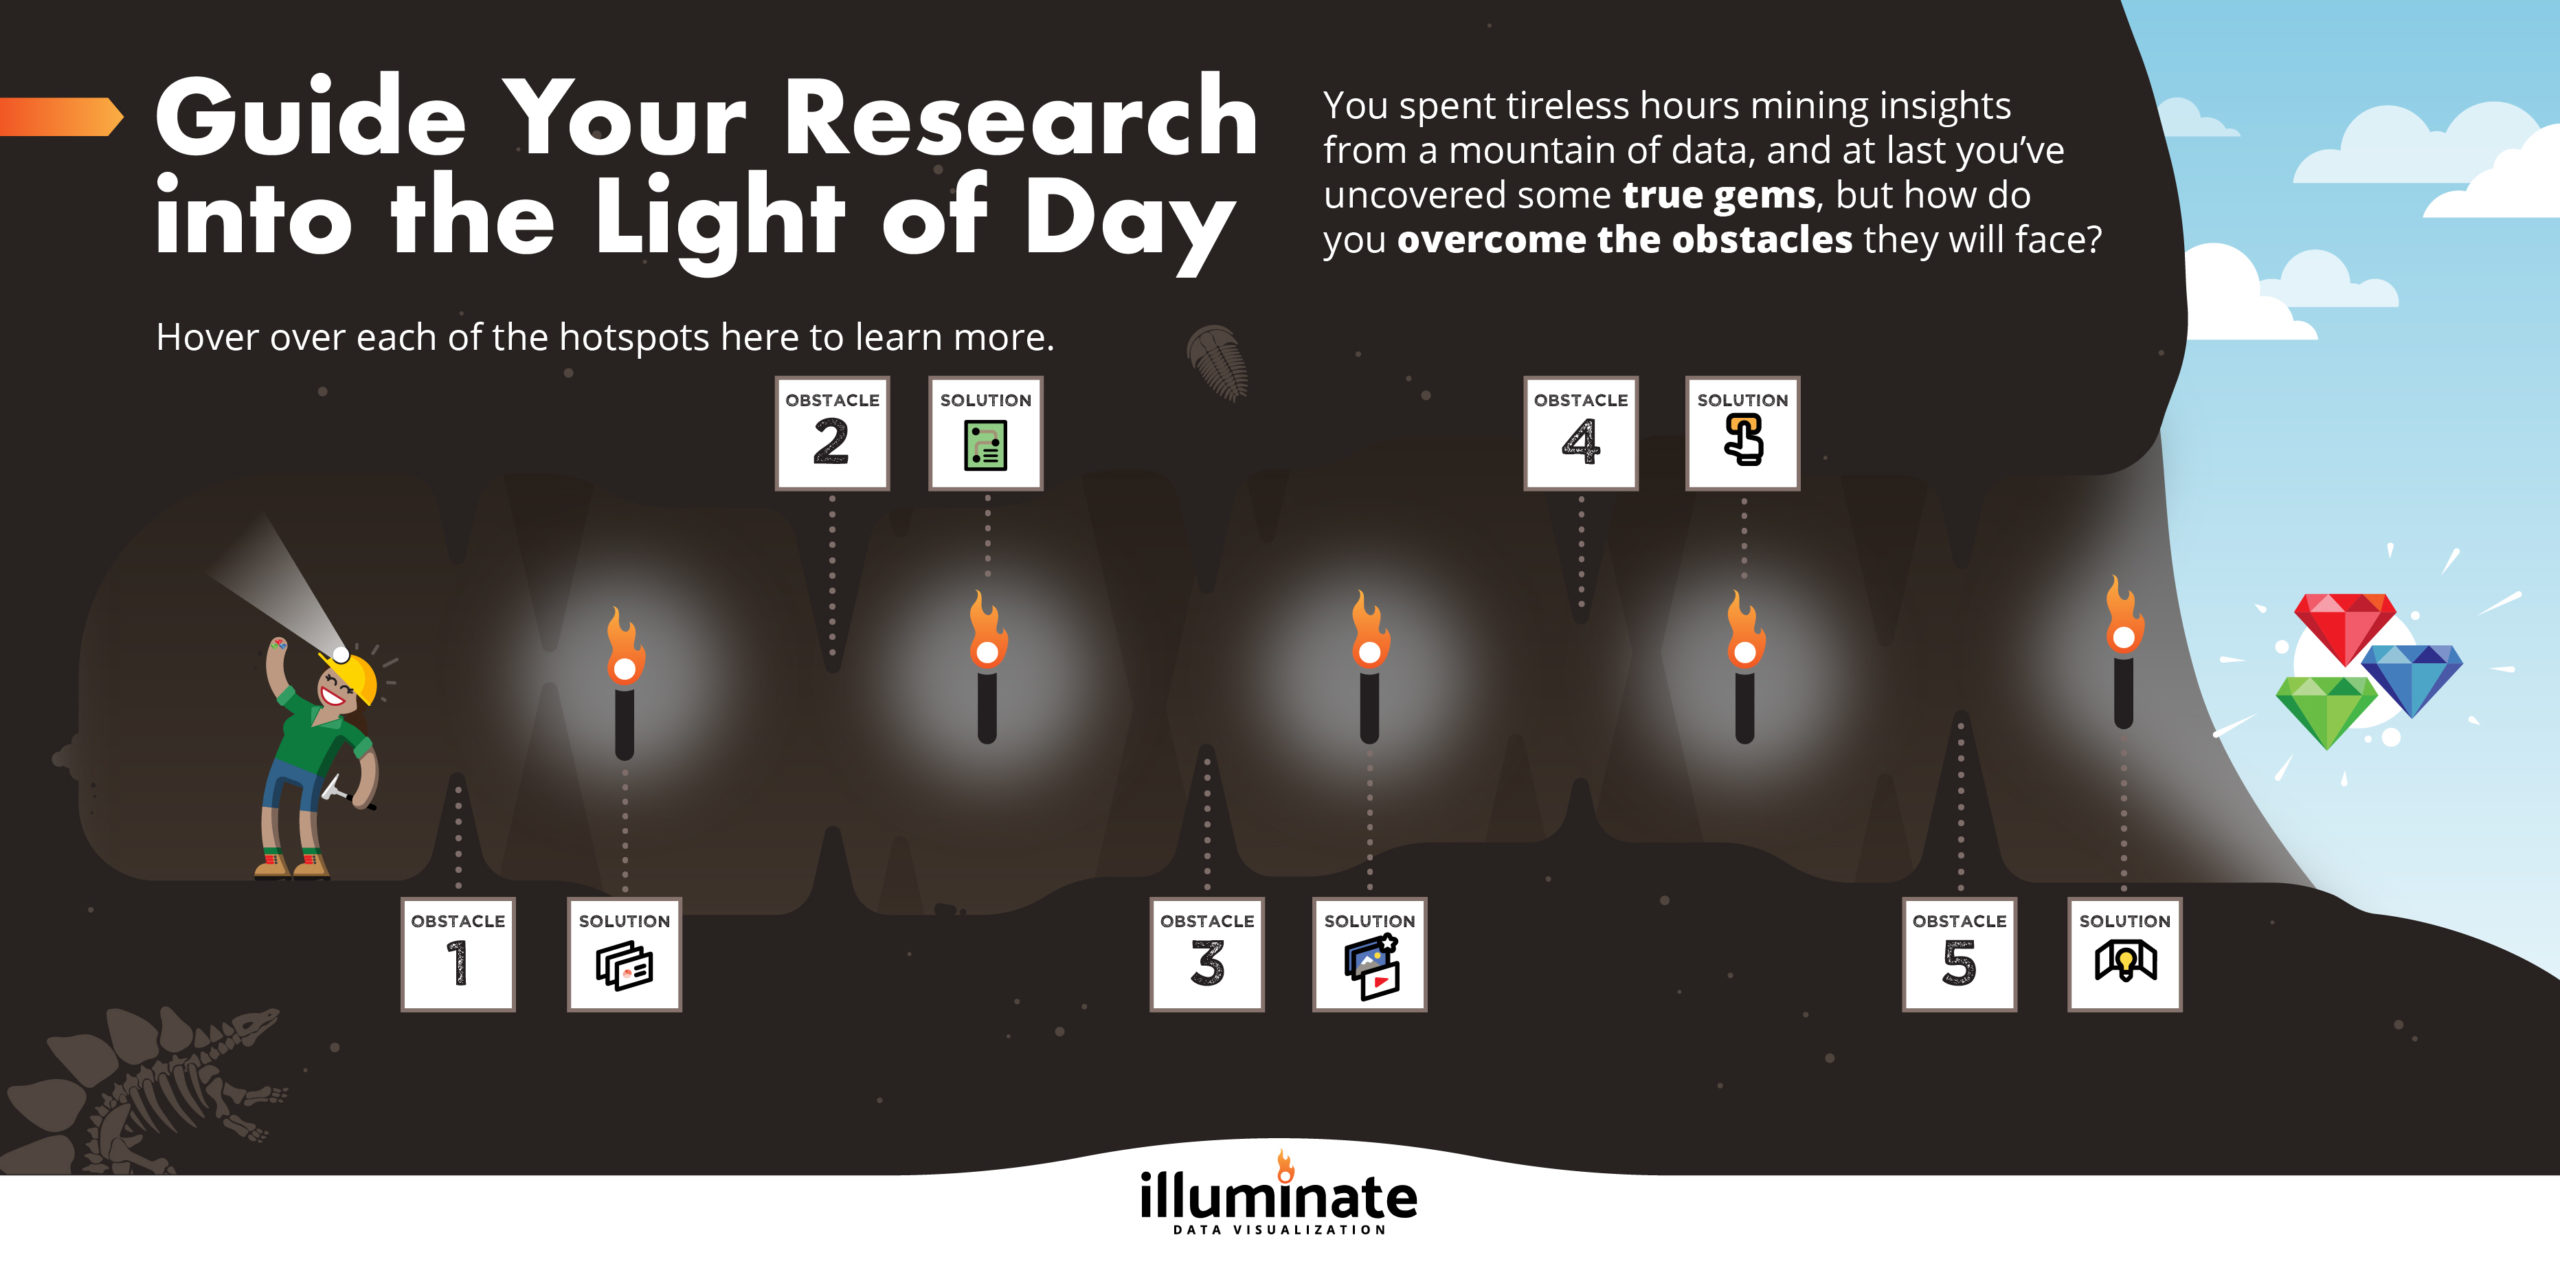
Obstacle 1
When stakeholders complain:
“Another boring PowerPoint deck?”
Solution: Visualized Presentations

When your deck looks amazing, your audience will watch (and absorb) until the very last slide.
Obstacle 2
Your client’s extended team may say:
“I see the data, but I can’t see the big picture!”
Solution: Infographics & Profiles

Illustrate all the key takeaways of an entire study in one beautiful, intuitive graphic.
Obstacle 3
You may have heard your client say:
“The C-suite doesn’t have time to read a report this long.”
Solution: Executive Decks & Explainer Videos

Streamline all the key data in your report with featured slides, a visually concise exec deck or an engaging explainer video.
Obstacle 4
While some stakeholders are working hybrid and remotely, you may hear:
“Our team is geographically spread out.”
Solution: Digital Experiences

Deepen the learning by creating interactive, web-based experiences that are easy to socialize with colleagues.
Obstacle 5
If they can’t experience the insights, you might hear:
“The team doesn’t fully embrace the findings.”
Solution: Immersion Spaces

Create richly detailed digital or real-world environments that stakeholders can tour.
In Conclusion
Successfully bringing your research into the light makes it accessible to and actionable by all stakeholders. In the eyes of your clients, both you and your research will sparkle.
Want to see more samples? See a few of our public-friendly infographics here, see other samples of our work here, or fill out the form below to start a deeper discussion about our capabilities.

